
We've all heard the tall tale that California is going to fall off into the Pacific Ocean, but did you know that the East Coast is actually sinking?
New satellite images show major cities on the U.S. Atlantic coast are sinking, in some cases as much as 5 millimeters per year -- a decline at the ocean's edge that well outpaces global sea level rise.
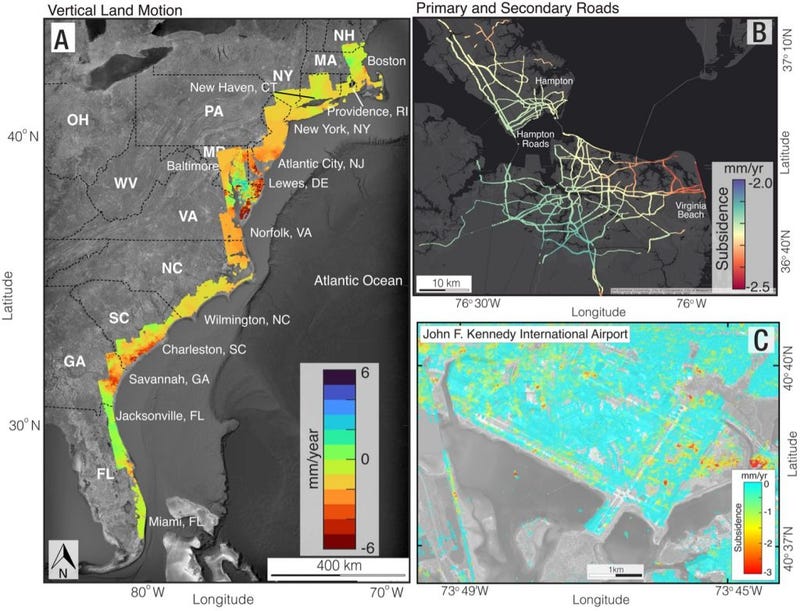
Particularly hard hit population centers such as New York City and Long Island, Baltimore, Virginia Beach and Norfolk are seeing areas of rapid "subsidence," or sinking land, alongside more slowly sinking or relatively stable ground, increasing the risk to roadways, runways, building foundations, rail lines and pipelines, according to a study published in the Proceedings of the National Academies of Sciences.
"Through this study, we highlight that sinking of the land is not an intangible threat. It affects you and I and everyone; it may be gradual, but the impacts are real," Manoochehr Shirzaei, associate professor at Virginia Tech's Earth Observation and Innovation Lab, said in a statement. "We measured subsidence rates of 2 millimeters per year affecting more than 2 million people and 800,000 properties on the East Coast."
For the study, the research team pulled together a vast collection of data points measured by space-based radar satellites and used the information to build digital terrain maps that show exactly where sinking landscapes present risks to the health of vital infrastructure.
The maps show that a large area of the East Coast is sinking at least 2 millimeters per year, with several areas along the mid-Atlantic coast of more than 1,400 square miles sinking more than 5 millimeters per year -- more than the current 4 millimeters per year global rate of sea level rise.
Lead study author Leonard Ohenhen said the research "should cause concern." In several cities along the East Coast, multiple critical infrastructures such as roads, railways, airports, and levees are affected by differing subsidence rates.
"Here, the problem is not just that the land is sinking. The problem is that the hotspots of sinking land intersect directly with population and infrastructure hubs," said Ohenhen. "For example, significant areas of critical infrastructure in New York, including JFK and LaGuardia airports and its runways, along with the railway systems, are affected by subsidence rates exceeding 2 millimeters per year. The effects of these right now and into the future are potential damage to infrastructure and increased flood risks."
Subsidence can undermine building foundations; damage roads, gas, and water lines; cause building collapse; and exacerbate coastal flooding – especially when paired with sea level rise.
Researchers say the study has far-reaching implications for community and infrastructure resilience planning, emphasizing the need for a targeted approach in transitioning from reactive to proactive hazard mitigation strategies in the era of climate change.