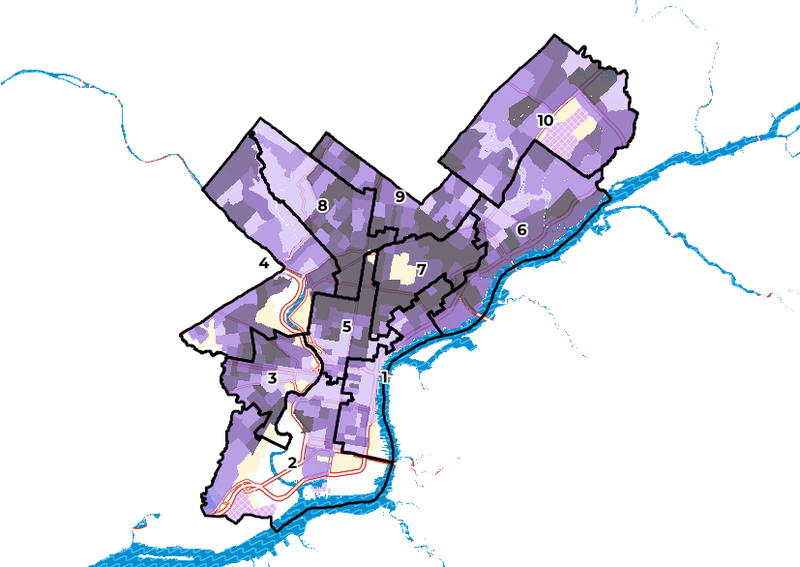
PHILADELPHIA (KYW Newsradio) — City officials on Wednesday unveiled a map that shows where people with disabilities live, along with other information to help guide decisions about services and supports.
“When you enter the map, you can see the percent of the population with a disability by census tract,” explained Dan Warner, the city commissioners’ geographic information systems analyst. He helped create this first-of-its-kind tool that, literally, puts people with disabilities on the map.
“This tool shows us what is possible when we lean in and use geospatial technology to understand the human experience of our residents.”
For West Philadelphia resident Yvonne Hughes, who is visually impaired, it’s important validation. “One of the things I love about this project is they thought about us,” she said. “We finally belong, and someone took the time to put it together.”
But the map is more than symbolic.
Philadelphia has the highest rate of residents with disabilities of any large city, at 17%. However, as the map shows, two-thirds of neighborhoods have higher rates, as high as 42%.
Deputy Streets Commissioner Rich Montanez says his department is using the map to prioritize where to put curb cuts. Amy Nieves, from the Mayor’s Office for People with Disabilities, says other departments, such as the Office of Emergency Management and the Managing Director’s Office, are using it to guide policy and spending, including all $10 million in the Operations Transformation Fund.
“This is not just a data project,” she said. “This is the key to how we can bring equity into action as a city.”
Mayor Jim Kenney says all residents are benefitting from the new map. “We have a better government and a better city when we are as inclusive as possible,” he said.
